Red Sox: Valuing Craig Kimbrel based on his nearest neighbors

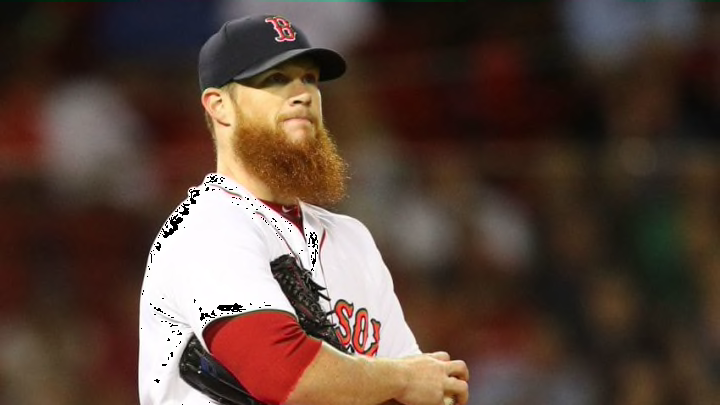
BOSTON, MA - JULY 11: Craig Kimbrel #46 of the Boston Red Sox reacts after walking in a run in the eighth inning of a game against the Texas Rangers at Fenway Park on July 11, 2018 in Boston, Massachusetts. (Photo by Adam Glanzman/Getty Images)
3 of 7
Next
HOUSTON, TX – OCTOBER 06: Craig Kimbrel #46 of the Boston Red Sox stands on the pitcher’s mound in the eighth inning against the Houston Astros during game two of the American League Division Series at Minute Maid Park on October 6, 2017 in Houston, Texas. (Photo by Bob Levey/Getty Images)
HOUSTON, TX – OCTOBER 06: Craig Kimbrel #46 of the Boston Red Sox stands on the pitcher’s mound in the eighth inning against the Houston Astros during game two of the American League Division Series at Minute Maid Park on October 6, 2017 in Houston, Texas. (Photo by Bob Levey/Getty Images) /

Will Craig Kimbrel live up to a long-term contract? Let’s analyze his closest comparisons to gain some insight on if he’s worthwhile for the Red Sox.

Historically, signing relievers to large contracts has proven to be a fool’s errand. Just look at this list of the highest paid relievers last season. Of the top ten – including the eight pitchers tied for tenth place – perhaps five of these pitchers earned their salary in 2018.

The Red Sox, however, are in a position where they need to pay a reliever a lot of money. Their closer Craig Kimbrel is on the open market and is reportedly demanding a contract in the ballpark of Aroldis Chapman’s five-year $85 million dollar pact. Without a doubt, the biggest question Dave Dombrowski faces this offseason is whether or not to re-sign Kimbrel. To that end, I thought it would be worthwhile to try to get a better picture of what Kimbrel’s performance might look like over the next few seasons.

CLEVELAND, OH – AUGUST 15: Closing pitcher Craig Kimbrel #46 of the Boston Red Sox celebrates after the final out against the Cleveland Indians at Progressive Field on August 15, 2016 in Cleveland, Ohio. The Red Sox defeated the Indians 3-2. (Photo by Jason Miller/Getty Images)
CLEVELAND, OH – AUGUST 15: Closing pitcher Craig Kimbrel #46 of the Boston Red Sox celebrates after the final out against the Cleveland Indians at Progressive Field on August 15, 2016 in Cleveland, Ohio. The Red Sox defeated the Indians 3-2. (Photo by Jason Miller/Getty Images) /

Methodology

I decided to run a K-Nearest Neighbors search to find the most similar pitchers to Kimbrel. I looked only at Kimbrel’s performance over the last three years – his age 28-30 seasons – and compared them to the seasons of other relief pitchers over the same age range.

First, I gathered all of the statistics on FanGraphs that are available from at least the 1974 season onwards (Win Probability Added started that season and it is also about the time frame in which the era of the modern closer began so it seemed like a good breaking point). I then recorded the cumulative fWAR of each of the same pitchers from their age 31-35 seasons. My goal was to determine statistics through a relief pitcher’s age-28 to age-30 seasons had the strongest relationship with their fWAR in their next five seasons (the expected duration of Kimbrel’s next contract). I calculated the correlation matrix between all of these statistics and looked to see which metrics correlated most highly with a reliever’s fWAR between age 31 and 35. The five metrics with the strongest relationship are below. In brackets is the r-value of each metric measured against relievers’ fWAR from age 31-35.

WAR (.4913), FIP- (-.4262) , WPA/LI (.3593), WHIP (-.3081), and K/9 (.2996).

Full disclosure: ERA- and FIP actually beat out the bottom two metrics above, but I cut them on the basis that they essentially attempt to measure the exact same thing that FIP- does. I then normalized these five metrics to have a mean of zero and a standard deviation of one (this is necessary because these metrics are all in different units) and multiplied each by the absolute value of their respective r-value listed above to properly weight for importance. I looked at the Euclidean distance between Craig Kimbrel’s performance over these three seasons and all other relievers since 1974 who pitched at least 150 innings between ages 28 to 30. We will countdown his five closest matches from least to most similar.

DETROIT, MI – OCTOBER 28: Octavio Dotel #20 of the Detroit Tigers reatcs after striking out Buster Posey #28 of the San Francisco Giants in the eighth inning during Game Four of the Major League Baseball World Series at Comerica Park on October 28, 2012 in Detroit, Michigan. (Photo by Ezra Shaw/Getty Images)
DETROIT, MI – OCTOBER 28: Octavio Dotel #20 of the Detroit Tigers reatcs after striking out Buster Posey #28 of the San Francisco Giants in the eighth inning during Game Four of the Major League Baseball World Series at Comerica Park on October 28, 2012 in Detroit, Michigan. (Photo by Ezra Shaw/Getty Images) /

Number 5: Octavio Dotel

PitcherERAFIP-WHIPIPK%BB%WPA/LIfWAR
Octavio Dotel  age 28-302.64691.00269.231.38.45.926.0
Craig Kimbrel  age 28-302.44570.91184.142.310.45.146.0
Difference in Performance (Kimbrel – Dotel)-0.2-12-0.09-85.1+11+2.0-0.78+0
Octavio Dotel  age 31-354.03951.41185.128.212.1-0.481.4

After watching him toil in mediocrity for the better part of a decade, it’s become easy to forget how dominant Octavio Dotel was in the early stages of his career.

From 2002-2004 – his age-28 through age-30 seasons – Dotel struck out 31.3% of batters, maintained an ERA of 2.64, and allowed a batting average against of just .183 in the middle of the steroid era.

Unfortunately, Dotel underwent Tommy John surgery in May of 2005 and managed to pitch only 56 innings between 2005 and 2007. He had a pretty clean bill of health after that point and pitched all the way through his age-39 season. However, he was never the same. Dotel failed to earn more than half of his 2004 fWAR total in a single season again until 2012.

Obviously, if Kimbrel undergoes Tommy John surgery next year his contract would be disastrous. But, while predicting injuries is a difficult task, there is little reason to think Kimbrel is a high risk for any major arm issues. Dotel threw at least 85 innings every year up through his age-30 season. In contrast, Kimbrel has not thrown more than 70 innings in a season since 2011. Kimbrel also lacks some of the tells of arm troubles. Namely, he has no history of elbow or shoulder injuries and his pitch repertoire doesn’t scream disaster. Specifically, he relies heavily on a curveball and doesn’t have a slider, which are two positive traits for pitchers hoping to avoid Tommy John surgery.

Dotel represents the worst case scenario for a Kimbrel contract, but it also doesn’t appear to be the most likely one.
NEW YORK – OCTOBER 09: Joe Nathan #36 of the Minnesota Twins pitches against the New York Yankees in Game Two of the ALDS during the 2009 MLB Playoffs at Yankee Stadium on October 9, 2009 in the Bronx borough of New York City. (Photo by Jim McIsaac/Getty Images)
NEW YORK – OCTOBER 09: Joe Nathan #36 of the Minnesota Twins pitches against the New York Yankees in Game Two of the ALDS during the 2009 MLB Playoffs at Yankee Stadium on October 9, 2009 in the Bronx borough of New York City. (Photo by Jim McIsaac/Getty Images) /

Number 4: Joe Nathan

PitcherERAFIP-WHIPIPK%BB%WPA/LIfWAR
      Joe Nathan      age 28-302.44631.01221.130.48.95.676.7
Craig Kimbrel  age 28-302.44570.91184.142.310.45.146.0
Difference in Performance (Kimbrel – Nathan)+0-6-0.10-37+11.9+1.5-0.53-0.7
    Joe Nathan  age 31-351.73590.91276.131.177.658.7

If Dotel represents the floor for Kimbrel’s future value, Joe Nathan has to represent the ceiling. Nathan’s performance was nearly identical to Kimbrel’s in their age-28 to age-30 seasons. The biggest distinction between the two is their K%, but this is largely attributable to the difference in the era that these two pitchers played in (Nathan was in the top 10 for relievers in K% from 2003-2005). Nathan, like Kimbrel was undeniably an elite reliever throughout his late twenties, but once he reached the other side of thirty he upped his game even further and cemented himself as one of the greatest relief pitchers of all time.

The bad news for those hoping Kimbrel delivers a similar performance is that Nathan’s later success was driven by his ability to keep his walk rate down as his stuff inevitably declined with age. Though their walk rates weren’t too far off during their respective age-28 to 30 seasons, Nathan was able to improve his walk rate to a near-elite level after his 31st birthday. Between 2006 and 2009, Nathan’s walked rate stayed below 7% every season.

It’s fair to say maybe Kimbrel can improve his walk rate as well, but there’s no reason to expect this type of drastic change. In Nathan’s case, his command had already been trending positively for years. He lowered his walk rate every season from 2003 to 2005, giving up free passes to 10.4%, 8.1%, and 8.0% of batters in his age-28 to age-30 seasons respectively. In contrast, Kimbrel walked 13.6%, 5.5%, and 12.6% batters in 2016, 2017, and 2018 respectively. That certainly isn’t a pattern that makes you think Kimbrel is going to make similar strides in his command.

Despite this, however, Nathan is still a very strong comp for Kimbrel. In every area except for free passes, it’s hard to separate the performances of these two pitchers from age 28 to 30. Kimbrel almost certainly won’t reach the level of excellence that Nathan achieved, but it wouldn’t be unreasonable to hope for Joe Nathan with a few more walks. If the Red Sox get a Nathan lite type performance over the next five years they would certainly be thrilled.

NEW YORK, NY – AUGUST 31: David Robertson #30 of the New York Yankees reacts after striking out the final batter to defeat the Detroit Tigers 7-5 in a game at Yankee Stadium on August 31, 2018 in the Bronx borough of New York City. (Photo by Rich Schultz/Getty Images)
NEW YORK, NY – AUGUST 31: David Robertson #30 of the New York Yankees reacts after striking out the final batter to defeat the Detroit Tigers 7-5 in a game at Yankee Stadium on August 31, 2018 in the Bronx borough of New York City. (Photo by Rich Schultz/Getty Images) /

Number 3: David Robertson

PitcherERAFIP-WHIPIPK%BB%WPA/LIfWAR
David Robertson age 28-302.83641.0119433.67.03.935
Craig Kimbrel  age 28-302.44570.91184.142.310.45.146.0
Difference in Performance (Kimbrel – Robertson)-0.39-7-0.10-9.9+8.7+3.4+1.21+1.0
David Robertson age 31-333.27811.112431.210.72.272

It’s a bit ironic that David Robertson shows up on this list given that the Red Sox were interested  in him this offseason before he inked a two-year pact with the Phillies. Considering how well Robertson has held up with age and how much less of a commitment he received, it makes one wonder whether he was the reliever to get this offseason instead of Kimbrel.

To be fair, it’s not that simple. Robertson will be 34-years old next season and even at his peak one would be hard pressed to argue that he was ever as good as Kimbrel is now. As you can see above, Kimbrel has been better in basically every area besides walk rate over the same ages (this is a pattern you’ll find comparing Kimbrel to most elite relievers as it’s hard to be as dominant as he has been while walking 13% of hitters).

But this exercise should make us all appreciate just how good David Robertson is. His performance during his age-28 to age-30 seasons was just a step below Kimbrel’s and he has maintained that performance in his three subsequent seasons. If the Sox re-sign Kimbrel and he holds up as well as Robertson has, they would have nothing to complain about.

KANSAS CITY, MO – SEPTEMBER 02: Wade Davis #17 of the Kansas City Royals pitches during the game against the Detroit Tigers at Kauffman Stadium on September 2, 2016 in Kansas City, Missouri. (Photo by Jamie Squire/Getty Images)
KANSAS CITY, MO – SEPTEMBER 02: Wade Davis #17 of the Kansas City Royals pitches during the game against the Detroit Tigers at Kauffman Stadium on September 2, 2016 in Kansas City, Missouri. (Photo by Jamie Squire/Getty Images) /

Number 2: Wade Davis

PitcherERAFIP-WHIPIPK%BB%WPA/LIfWAR
   Wade Davis  age 28-301.18470.89182.233.18.45.746.3
Craig Kimbrel  age 28-302.44570.91184.142.310.45.146.0
Difference in Performance (Kimbrel – Davis)+1.26+10+0.02+1.9+9.2+2.0-0.6-0.3
Wade Davis age 31-323.27811.112431.210.72.272

Wade Davis’ run from 2014 to 2016 was nothing short of phenomenal. Pitchers simply don’t maintain ERA’s that close to one for three consecutive seasons. At first glance, it seems like Kimbrel’s performance over the past three seasons isn’t at the same level as Davis’ stretch at the same age.

However, when you look beyond ERA, it becomes apparent that these two weren’t all that far apart. Kimbrel’s FIP- is very close to Davis’ and Kimbrel actually outperformed Davis in both xFIP and SIERA. That makes a lot of sense when you look at the AL East lineups from the past three seasons and the dimensions of Fenway Park and compare those to the conditions that Davis pitched in.

More from Red Sox News

In any event, Davis’ last two years have not been as kind to him as 2014-2016 were. That’s not to say he’s been a bad pitcher. In fact, at a surface level, it seems like he pitched at an elite level for the Cubs in 2017. Even last year, when his ERA ballooned to 4.13, wasn’t nearly as bad for Davis as it appeared when you remember that he pitched in Coors Field half the time. But these past two years have still been a far cry from the dominance he enjoyed a couple years earlier. In both of the past two seasons, his xFIP has hovered around the mid threes and his walk rate has jumped above 10%.

Davis is still a very good pitcher and one I would love the Red Sox to have but he is not who he was when he left the Royals. This is the kind of realistic decline I would expect Kimbrel to undergo over the next few seasons. Kimbrel’s probably too good to fall off a cliff, but if walks continue to be an issue he could easily fall into being a very good reliever instead of a great one and that’s not how he will be paid. This would be far from the nightmare scenario, but it’s also not ideal.

CLEVELAND, OH – SEPTEMBER 29: Andrew Miller #24 of the Cleveland Indians pitches against the Chicago White Sox during the ninth inning at Progressive Field on September 29, 2017 in Cleveland, Ohio. The Indians defeated the White Sox 10-1. (Photo by Ron Schwane/Getty Images)
CLEVELAND, OH – SEPTEMBER 29: Andrew Miller #24 of the Cleveland Indians pitches against the Chicago White Sox during the ninth inning at Progressive Field on September 29, 2017 in Cleveland, Ohio. The Indians defeated the White Sox 10-1. (Photo by Ron Schwane/Getty Images) /

Number 1: Andrew Miller

PitcherERAFIP-WHIPIPK%BB%WPA/LIfWAR
Andrew Miller age 28-302.15520.94154.240.38.73.524.6
Craig Kimbrel age 28-302.44570.91184.142.310.45.146.0
Difference in Performance (Kimbrel – Dotel)+0.29+5-0.03+29.9+2.0+1.7+1.62+1.4
Andrew Miller age 31-332.00490.8817139.16.85.155.7

And Kimbrel’s closest neighbor is perhaps the only pitcher who can match Dirty Craig strikeout for strikeout. Andrew Miller and Kimbrel account for two of only three relievers in MLB history to strike out more than 40% of batters in their age 28-30 seasons in at least 150 innings of work (the other is Dellin Betances).

Miller was, of course, a Red Sox himself once upon a time. A post-hype prospect, Boston acquired Miller in 2011 as a reclamation project and revitalized his career before trading him for Eduardo Rodriguez in 2014. Miller didn’t fully find his footing until his late 20’s but once he did he became flat-out unhittable. His rate stats above mirror Kimbrel’s almost perfectly and, judging by his performance after he turned 31, that’s not bad news.

Miller would only become more dominant during 2016 and 2017. Over those two seasons, his ERA+ was 311 and striking out 14.3 per nine while allowing only 2 walks and 4.8 hits per nine. Last season didn’t go as well for the southpaw. Miller battled shoulder injuries all year in 2018 and greatly underperformed expectations, but if the Red Sox had signed Miller to a 5-year $85 million dollar deal before 2016 and things had played out the same for him it’s hard to believe anyone would be complaining right now.

So there you have it. This exercise has not given us a concrete idea of what to expect from Craig Kimbrel in the near future. He probably won’t blow up like Dotel and he probably won’t be historically great like Miller and Nathan. But it has given us a range of possible outcomes based on historical precedent.

Next. End of 2018 roundtable. dark

The results of this analysis appear to make sense. It seems like a reasonable distribution of results to say that 1/5th of the time a Kimbrel contract looks like a disaster, 2/5ths of the time it becomes a slight overpay, and 2/5ths of the time he’s worth every penny. If that’s about right then the next question is this: Should the Red Sox make that gamble? With the current free-agent market for relievers and the dearth of prospects that the Sox can trade for a backend bullpen piece, I’d say it definitely is.

Next