Lineup
| 1998 New York Yankees | |||||||
| Position | Name | PA | HR | BA | OBP | SLG | OPS+ |
| C | Jorge Posada | 409 | 17 | 0.268 | 0.35 | 0.475 | 115 |
| 1B | Tino Martinez | 608 | 28 | 0.281 | 0.355 | 0.505 | 124 |
| 2B | Chuck Knoblauch | 706 | 17 | 0.265 | 0.361 | 0.405 | 102 |
| SS | Derek Jeter | 694 | 19 | 0.324 | 0.384 | 0.481 | 127 |
| 3B | Scott Brosius | 603 | 19 | 0.3 | 0.371 | 0.472 | 121 |
| LF | Chad Curtis | 545 | 10 | 0.243 | 0.355 | 0.36 | 90 |
| CF | Bernie Williams | 578 | 26 | 0.339 | 0.422 | 0.575 | 160 |
| RF | Paul O’Neill | 672 | 24 | 0.317 | 0.372 | 0.51 | 130 |
| DH | Darryl Strawberry | 345 | 24 | 0.247 | 0.354 | 0.542 | 132 |
| 2001 Seattle Mariners | |||||||
| Position | Name | PA | HR | BA | OBP | SLG | OPS+ |
| C | Dan Wilson | 408 | 10 | 0.265 | 0.305 | 0.403 | 90 |
| 1B | John Olerud | 679 | 21 | 0.302 | 0.401 | 0.472 | 136 |
| 2B | Bret Boone | 690 | 37 | 0.331 | 0.372 | 0.578 | 153 |
| SS | Carlos Guillen | 523 | 5 | 0.259 | 0.333 | 0.355 | 87 |
| 3B | David Bell | 510 | 15 | 0.26 | 0.303 | 0.415 | 92 |
| LF | Al Martin | 324 | 7 | 0.24 | 0.33 | 0.382 | 93 |
| CF | Mike Cameron | 633 | 25 | 0.267 | 0.353 | 0.48 | 123 |
| RF | Ichiro Suzuki | 738 | 8 | 0.35 | 0.381 | 0.457 | 126 |
| DH | Edgar Martinez | 581 | 23 | 0.306 | 0.423 | 0.543 | 160 |
| 2018 Boston Red Sox | |||||||
| Position | Name | PA | HR | BA | OBP | SLG | OPS+ |
| C | Sandy Leon | 228 | 5 | 0.212 | 0.267 | 0.332 | 61 |
| 1B | Mitch Moreland | 361 | 14 | 0.254 | 0.321 | 0.464 | 109 |
| 2B | Ian Kinsler | 11 | 0 | 0.4 | 0.455 | 0.5 | 158 |
| SS | Xander Bogaerts | 433 | 17 | 0.275 | 0.351 | 0.505 | 128 |
| 3B | Rafael Devers | 423 | 16 | 0.242 | 0.298 | 0.422 | 92 |
| LF | Andrew Benintendi | 508 | 15 | 0.298 | 0.380 | 0.500 | 135 |
| CF | Jackie Bradley Jr. | 406 | 11 | 0.218 | 0.305 | 0.387 | 86 |
| RF | Mookie Betts | 466 | 27 | 0.352 | 0.440 | 0.668 | 194 |
| DH | J.D. Martinez | 500 | 37 | 0.333 | 0.402 | 0.663 | 181 |
The ’98 Yankees had far and away the most balanced attack with only one hitter batting below league average and seven hitters that were 15% or more above average by OPS+. These Yankees lacked the star power that the other two lineups feature; they didn’t have a single batter topple thirty homers and only Bernie Williams was truly exceptional at the plate. However, almost everyone in that lineup was a threat to do serious damage and the 2018 Red Sox can’t say anything of the sort.
The ’01 Mariners saw the emergence of Ichiro Suzuki in Major League Baseball and it was sensational. He will never get as much love from a stat like OPS+ as bona fide sluggers, but his .350 batting average coupled with off the charts speed – he stole 56 bases – gave the Mariners one of the best spark plugs in recent memory. Also of note are Brett Boone and Edgar Martinez absolutely mashing and John Olerud and Mike Cameron quietly putting together stellar seasons. These Mariners, however, had four players in their lineup with an OPS below .720 and when almost half your lineup lacks teeth you have to take a backseat to the Yankees lineup listed above.
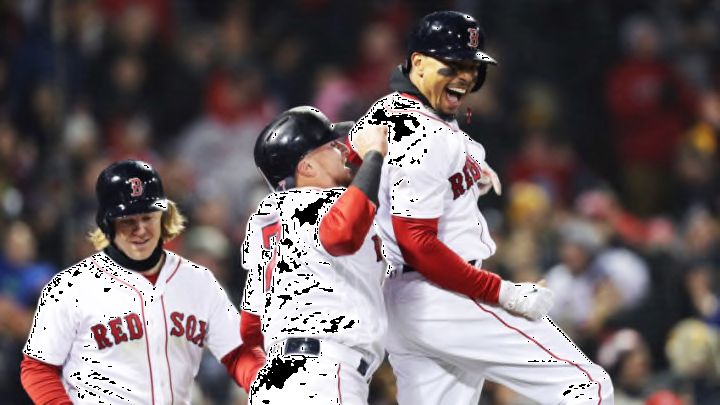
And finally, we have by far the most lopsided lineup. J.D. Martinez and Mookie Betts are having two of the greatest offensive seasons in Red Sox history while Sandy Leon and Eduardo Nunez are looking like black holes at the plate. Jackie Bradley and Rafael Devers aren’t too far removed from black hole status either. Andrew Benintendi and Xander Bogaerts have also been very good and, despite his recent struggles, Moreland still grades out above average. To be fair, Ian Kinsler is the second baseman going forward which removes one hole from the lineup and, when lefties are on the mound, Steve Pearce gives Boston a more formidable presence. But as it stands the Red Sox lineup is very much in the stars and scrubs category with four or five batters generating almost all of the offense every night.
To get a more general picture we should note that the Yankees scored 5.96 runs per game, the Mariners scored 5.72 runs per game, and the Red Sox have scored 5.46 runs per game to date. The Red Sox may have the best offense in baseball this year, but they fall short of these two juggernauts at the plate.
