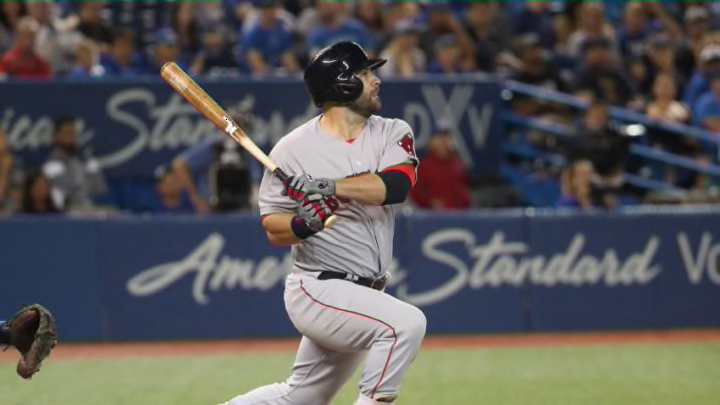
The 1967 Boston Red Sox had a great two-way first baseman, George Scott. A Gold Glove defender and .300 hitter who is now matched-up in a throw-down with Mitch Moreland.
The 50th anniversary of the “Impossible Dream” 1967 season is a continuous celebration for Boston Red Sox fans and for me the opportunity to compare. This throw-down is a look at the two first basemen – George Scott and Mitch Moreland.
Defensively, both players are far above average. Scott, despite his size, was nimble, quick, had great hands, excellent instincts and won a Gold Glove for his 1967 defense. Moreland certainly has similar traits and in 2016 won a Gold Glove. Both are anchors in the infield.
The Red Sox teams in the two seasons had similar issues with defense at third base. Joe Foy in 1967 had 27 errors and Scott – also known as “Boomer” – probably saved Foy another baker’s dozen. Foy finished 1967 with a -10 on Total Zone.
More from Red Sox History
- Two notable Red Sox anniversaries highlight current organizational failures
- Contemporary Era Committee doesn’t elect any former Red Sox to Hall of Fame
- Johnny Damon calls Red Sox out, reveals hilarious way he skirted Yankees’ grooming policy
- Remembering the best Red Sox Thanksgiving ever
- Red Sox World Series legends headline 2023 Hall of Fame ballot
The 2017 Red Sox lead all American League teams with errors committed at third base with 26 and counting. The stability that Deven Marrero brought to the position has depreciated with the advent of the Rafael Devers era. Moreland – like Scott – has managed his share of saves with a league second ranking of seven defensive runs saved.
I see little difference between either with their ability at first base. Scott may have had a bit more flash at first than Moreland, but Moreland is quite gifted at his ability to capture low throws – maybe better than the Scott I remember? This is simply an equal choice from my perspective.
The offense is a different tune.
Offensively, it was a different era that Scott played in. This was an era dominated by pitchers and 1967 saw a minuscule – by today’s standards – American League 3.23 ERA. The pitching mound being altered and the next wave of expansion would not begin until after the 1968 season. So a mano a mano comparison is one where judicious use statistics must be used.
Scott’s offensive year was simply superior to Moreland’s 2017 by both traditional and metric standards. Scott hit .303 with 19 home runs and had 82 RBI. Moreland may exceed the home run total, but his average is 50 points lower and the RBI total will fall considerably short. Moreland also gets some plus points for playing with a broken toe that certainly is an issue vis-a-vis performance.
Where the measurement separates is how both performed regarding league comparison. Scott’s OPS was .839 and the American League average was just .703. Moreland is now 10 points higher than the league OPS of .755. Scott’s .303 batting average was 50 points higher than league average. Moreland’s is eight points lower than league average at .248.
More from Red Sox History
- Two notable Red Sox anniversaries highlight current organizational failures
- Contemporary Era Committee doesn’t elect any former Red Sox to Hall of Fame
- Johnny Damon calls Red Sox out, reveals hilarious way he skirted Yankees’ grooming policy
- Remembering the best Red Sox Thanksgiving ever
- Red Sox World Series legends headline 2023 Hall of Fame ballot
Moreland has seen the bench due to an inability to consistently hit left-handed pitching. This season Moreland is hitting .242 against lefties and .249 against right-handers. Not bad. Where it shows is career power numbers since only 18 of Moreland’s 128 career home runs have come at the expense of a lefty.
Scott had no difficulties with either side hitting lefties at .298 and righties at .304. Home and road splits were quite similar for both with Scott hitting 37 points higher at Fenway Park and Moreland 30 points higher at home.
Other more intricate metrics such as RE24, REW, RC/G and a plethora of others show an edge to Scott. One area where Moreland does well is in ISO with a .186 to .163 and doubles certainly impact that total. Moreland was actually leading the AL in that department the first six weeks. BB% and K% show, not great illumination for either. Since the 2017 season is not over, there is some fluidity to Moreland’s numbers, but enough of a sample exists to give a clear view of his statistics. Moreland is on track to perform as he has throughout his career.
Next: Red Sox September standings watch
The cherry-picking of statistics show that Scott had a great offensive season in 1967 – in 1968 he would sink to .171. Based on the pitching of the era it was even more impressive. The Scott of 1967 was just a far more capable offensive threat than Moreland of 1967. For the fans of WAR it is no contest as Scott had a 4.4 fWAR and Moreland is at 0.8 fWAR. So in this throw down, it is Scott.
